25 December 2013

Sending Qlikview Reports in Excel


Would not it be nice if we could send some qlikview charts by email to a recipient automatically?

By using qlikview OCX and a piece of C# code, we can do this!!!

Let's examine the attached solution:

1) We need an excel template under template folder in which the position and the name of the qlikview chart to be transferred into excel is defined.
For example:
In the screenshot below, the definition CH01;image;0.5 in cell A1 means, export the chart CH01 from qlikview as an image and resize it by factor 0.5 and position its top-left corner with cell A1.
The definition CH02;text in cell H1 means, export the chart CH02 from qlikview as text and position its top-left cell with cell H1.


2) The output folder is used to copy the template into with a unique name and transfer the data from qlikview to this unique excel file before it is sent by email.

3) The qlikview file(s) should be placed in the same directory as template and output folder.

4) The excel template should have the same name as qlikview file. For example: if the qlikview file is named as Contoso-Simple.qvw then the excel file should be named as Contoso-Simple.xlsx.

5) The email account credentials which will be used to send the email are stored in app.config file.


How to use the application:

Before using the application, provide the email account credentials in app.config file which is under reportertest\Reporter\Reporter folder.

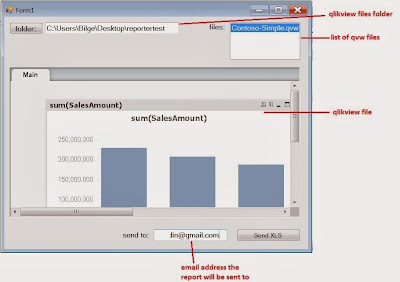
1) Manual use: double click on the reporter.exe under reportertest\Reporter\Reporter\bin\Debug folder. In the opening screen:
  • select the folder where qlikview files and template and output folders are located
  • select the qlikview file
  • make any selection in the qlikview file shown in the big frame
  • enter email address to which the excel report will be sent
  • click on Send XLS


2) Automatic use:  The reporter.exe can also be called from console or scheduled to run automatically in windows scheduled tasks. While calling from console or scheduling it requires five arguments:

arg 1: full path of the file
arg 2: user name (if section access is used in qlikview file)
arg 3: user password (if section access is used in qlikview file)
arg 4: selections to be made in the qlikview file 
arg 5: the email address to which the report will be sent

For example: The following console command will open the reporter application, access the contoso-simple.qvw file, then make the selections (20071 and 20072 as CalendarQuarter Online as ChannelName) and send out the excel report to xyz@gmail.com.

Reporter.exe "C:\\Users\\Bilge\\Desktop\\HappyStartinUSA\\OCX\\Contoso-Simple.qvw" "" "" "<CalendarQuarter:number:20071,20072><ChannelName:text:Online>" "xyz@gmail.com"


Source Code

Here is the source code and sample files (template, qvw file): reportertest.zip


05 August 2013

Qlikview: Missing data points due to data reduction


If data reduction is enabled, the data available in the qlikview application is filtered according to the user logging in. For example, if the logging in user has no "sales" data associated with him/her for "Product A", "Product A" will be filtered out for this user.

This may make sense in most of the cases, however same thing exists for "date" data too. If the logging in user has no "sales" data for "July 2012", then once logged in, (s)he will not have "July 2012" data point in his/her "sales per month" chart. This may not be what is expected; expected chart behavior might be to have a "0" value data point for "July 2012".

A possible workaround for this issue is as follows:

1) Since data reduction is filtering out data, we need to prevent data reduction in "date" data. This can be achieved by the STAR function of qlikview (Pls see the script in the sample qlikview app). In the sample qlikview app, I preferred to create a duplicate of DateDim table in which data reduction is prevented, that way I can use the regular DateDim table as usual and the duplicate table (DateDim_ALL) for recuperating the filtered out "date" data.

In the sample qlikview application, please login as "User1" and observe that "CalendarMonth" field is missing "200802" and "200803" but  "CalendarMonth_ALL" field does not.

2) Create a chart with "CalendarMonth_ALL" as dimension and observe that missing dates are still missing :(.

3) Add a hidden expression (as first expression) that counts the "CalendarMonth_ALL" between the MAX and MIN dates available in fact table.

4) Set dimension limit to show "greater than zero", as dimension limit is applied to first expression, it is applied to the expression mentioned in the step above.

5) Make the chart read-only, as selections made on "CalendarMonth_ALL" won't be reflected across the application.

Please see the bottom chart in the sample application as an example. Try logging in with "User1", "User2" and "User3".

Here is the link to download the sample application: missing.qvw


19 April 2013

Qlikview: Highlighting selected dimensions


If there are too many data points (or lines, or bars, etc) displayed in a chart, the user might want to highlight the ones which (s)he is interested in while still keeping the others in a lose color to be able to make comparison.

This can be done as follows:

  1. Let user make selections in dimensions
  2. Get selected values of each dimension into a separate variable when a button (e.g HIGHLIGHT) is clicked
  3. If a dimension value of a chart do not exists in the values kept in the variable, then color it as light gray. This can be done by background color setting.

Here is a link to the example qlikview application: Highlight.qvw

Please, open the highlight.qvw, make a couple of selections in list boxes and click on Highlight Selected button and observe the highlighting.